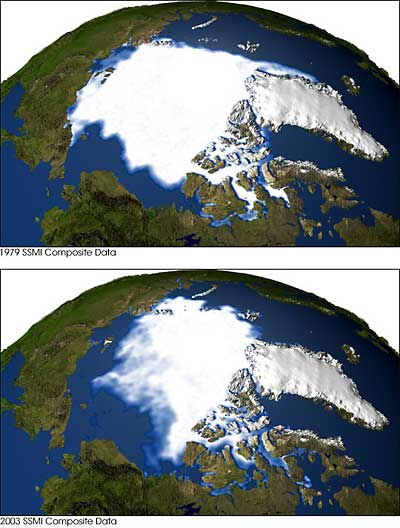
Visualization of minimum extent of arctic sea ice in 1979 and 2003, from NASA.
The goal of this project is to make an interactive visualization of the
sea ice concentration data
from the National Snow and Ice Data Center, showing how the extent of the
sea ice has changed from 1978 to the present.
Your target audience is the general public, perhaps the Picnic Day visitors.
Your visualization
should therefore aim, simultaneously, at engaging the user and at
accurately presenting the data.
We will concentrate on the northern hemisphere. There is both daily and monthly average data; we will use just the monthly data. We will need both the "final" and the "preliminary" data to cover the whole time period. Be sure to read the README on the FTP site; it's helpful.
Your programs should include a visualization of the data on a sphere in 3D, as in the images above, and also one or more iso-contours. It will be judged on its technical quality and on its sucsess in engaging and informing the user.
You are welcome to include other data. For instance, here are some earth images that might be useful. Be sure to hand in the other data along with your program.
Here is a suggested timetable:
Your program should run on the CSIF machines in the Kemper basement.
Submit the program using the handin script: put all the files required to compile and run your program into a directory (including a README, but NOT including the monthly ice coverage data), cd into that directory, and type "handin cs177 ice *.
I have put all of the monthly ice coverage data (preliminary and final files both) in
a directory on the CSIF system, ~amenta/ice_data. If you can make your project read the data from here, it will make it easier for me to grade! Thanks!
For a bigger picture of what the sea ice concentrations mean,
see the relevant chapter of the
State of the Arctic Report from NOAA.
NSIDC provides good
information on the derivation of this data, and cautions about its
interpretation.
While the objective of this project is to develop an interactive
visualization, if you come up with neat stills, they might be appropriate
for the global warming art
wiki.
Links
Check out the README file for the data, it describes how to get all the
files at once.