ECS163 Homework and Projects
All submissions are done at Smartsite.
Homework 1: Find and present a visualization you like (5%)
Assigned: 1/4
Due: 1/8 11:55pm (electronic submission)
Presentation: 1/11 and 1/13 in class
Description:
In this homework, you are asked to find an example of what you believe is a good visualization or visual-based interface, create a web page to document it, and present it to the class. Of course, since it is early in the quarter, and we haven't completely defined what makes a visualization/interface "good" yet, we don't expect you to find flawless visualizations or interface designs; most will have both good and bad aspects. Look for a visualization or interface design that is interesting/intuitive and relevant to you. You can find visualization examples in various places such as WWW, library, newpapers, or magazines. However, no information visualization textbook or technical paper may be used.Once you have selected an example, make a web page. Include in your web page your name, a picture of the visualization/interface, and two paragraphs (~200 words) for the picture. The first paragraph should tell the story behind the picture: what does this picture show? The second paragraph should critique the visualization, explaining why you think it is good and what you think could be improved. Be specific, and include criteria such as accessibility, clarity, accuracy, or any other criterion about the design of the visualization that you feel is important. Similarly, if you would choose a visual-based interface to present, describe the purpose of the interface and explain why you think it is good and what could be improved.
You will present your selected visualization/interface in class on either 1/11 or 1/13 using your webpage. Your in-class presentation should be about 2 minutes, and you should expect some questions and comments afterwards.
When submitting files through SmartSite, please format your webpage files the following way: Name your HTML file index.html, and the main visualization picture to cover.png. Zip these two files (and any other files used to build your webpage, such as a CSS file) and name the zipped file as lastname_firstname.zip. Submit this zipped file containing the html and image file to us by the deadline.
Project 1 and 2 Grading Breakdown
Projects 1 and 2 are graded based on the following criteria. The final project's grading breakdown is listed in its Requirements and Grading section.
- Milestones are met - 10% of the project
- Task completion and project formatting - 60% of the project. The system visualizes the required tasks that are listed for the project, the project files are formatted correctly, and the readme file is written.
- Interface design and interaction mechanisms - 30% of the project. Basically, is the system well thought out and designed, or does it seem halfway completed? This can include things like if the visual designs and layouts make sense, visual encodings are meaningful and effective (including color choices, make sure they're not confusing), there is user interaction, and the system is responsive (fast).
- Extra credit - up to 20% for projects that feature exceptional features and/or further analysis the data than what is required.
- Late Projects - 10% penalty per day.
Project 1: Visualizing a Minecraft dataset using D3 (20%)
Assigned: 1/11
Milestone: 1/20 11:55pm (electronic submission)
Due: 1/28 11:55pm (electronic submission)
Minecraft Overview:
The objective of Project 1 is to visualize and analyze the VE Datapack of Minecraft data using D3 (d3js.org). Minecraft is a sandbox video game originally created by Swedish programmer Markus "Notch" Persson and later developed and published by Mojang. You place blocks to build anything you can imagine, like an Imperial Star Destroyer or a house. Other activities in the game include exploration, resource gathering, crafting, and combat.
The VE Datapak contains Minecraft event data that can be analyzed and explored to see individual player play and interaction patterns. Some users play alone, while some collaborate or compete against each other. Some play solely on one server, while others play across multiple servers. The time span for game play is four weeks of wall clock time, on a granularity of minutes. Your project's specific tasks are defined below, but your main goal is to be able to analyze and show the data. How you show the data and do your analysis is up to you, so think about which view(s) will be effective. Remember to apply principles from lectures and readings. Trying different techniques may lead to finding the one that works better!
Data
The full data is available at here (~43 MB zipped, ~300 MB uncompressed). Servers are identified by random strings, such as [509fb8211dbf9d6b7e000004]. Similarly, players are identified by random strings, such as [baba27973f7f497e51d553f0b233ba7df42ac8ae]. The time data is reported in minutes. Time intervals in the VE Datapak lasts a minute or more (so start_t < stop_t). A time value of 0 means 00 hour, 00 minute on the first day of data collection.
vedatapak_full.csv
| Name | Type | Comment |
|---|---|---|
| start_t | int | start time of a time interval |
| stop_t | int | stop time of a time interval |
| server_id | anonymized string | id of the game server from which the event is collected |
| player_a | anonymized string | id of the primary player in this event |
| player_b | anonymized string | id of the secondary player in this event |
| key | string | type of event |
| meta | string | meta data giving more detail about the event |
| count | int or float | a numeric attribute describing the event |
There are two types of events that involve two players: Chat and KilledBy, both of which define a one-directional relationship. These types of records look like the following example, which come from the one-minute interval [24780-24781] on the server [509fb8211dbf9d6b7e000004]. The fields of player_a and player_b are populated. The key field denotes the type of event: KilledBy for the first example and Chat for the other.
********* Two-Player Events **********
24780, 24781, 509fb8211dbf9d6b7e000004, 1bbe90a19292f745edd527085838d6b0b77d67a5, baba27973f7f497e51d553f0b233ba7df42ac8ae, KilledBy, , 1
24780, 24781, 509fb8211dbf9d6b7e000004, 56dfed03423fb02bdabd40367bf5310f5f00cc34, baba27973f7f497e51d553f0b233ba7df42ac8ae, Chat, , 1
Be aware that there are some events that have to do with how Minecraft handles abnormal behavior from a game client. Those scenarios include: when a client is using a pirated game client or using a hacked client to cheat. When abnormal behavior happens, or simply when the server is not allowing new players to join the game, the Minecraft server will "kick" the player off the server. These kick events are captured, and reported in VE Datapak.
Implementation
Your visualization aspects should be implemented with D3. You will need basic knowledge of HTML and JavaScript syntax before you begin. If you have never written any HTML or JavaScript before, PLEASE START EARLY.
- The W3 Tutorial is a good starting tutorial for HTML.
- They also have a JavaScript tutorial here.
- The D3 website lists a large number of examples which are great for inspiration and finding example visualizations (and code!).
- If you are having trouble reading files with D3, it's probably because your browser won't let you read files from the local filesystem. See here or for how to run a local server on your machine.
Loading a 300MB file using D3 will crash your browser, so you will have to do some data preprocessing. Think about the data view(s) that you want to implement, and format the data accordingly. Create new csv or txt files of the aggregated or formatted data. These files will be smaller, since they only show particular aspects of the data. This will help make your system faster and let you include more interaction in it, as you only need to reference the pertinent data that you are currently viewing or interacting with.
Milestone
Both the Milestone and final submissions will be made through SmartSite.
The purpose of the Milestone is to show that you are making sufficient progress by being able to load data in D3. By this point you should have an understanding of how to load the dataset and display an initial view of the data using D3 / Javascript / HTML. Create a short .mov or .mp4 video (no longer than 30-60 seconds) that shows your current system's progress, and name it lastname_firstname.mov (or .mp4). If you are on a team, only 1 member needs to upload the video, and it can be named after that team member. Note that the largest individual filesize that SmartSite allows for upload is 120mb, but your should be well under that.
The video should show at least one visualization of the data using D3 (either from task 1, task 2, or 3), along with some sort of basic interactivity that you have thus far implemented. Audio narration is allowed, though not required. After creating the video, you will upload 3 files on SmartSite: the video file, a short text file named readme.txt where you narrate what the video shows, and a screenshot of your current system named cover.png. (10% of the project.)
Completed Project
The completed project will be submitted via SmartSite as a zipped file, and selected projects will later be presented to the class. The project files should be formatted as follows:
- Zip all files into a compressed file named lastname_firstname.zip, similar to homework 1. (Don't zip the folder containing all of the project files, zip the files themselves.)
- The main webpage HTML file should be named index.html. This should be in the zip file's root.
- Include the referenced *.js, *.css, and data files. Make sure they are locally referenced (including the d3 library javascript file). I recommend that you put the files in subfolders (such as ~/data/, ~/js/, etc), so your project is easier to manage, especially if you use a large number of derived data files.
- Include a screenshot of your system called cover.png, and your readme.txt text file. These should be in the root of the zipped file too.
Submit only the zipped file on SmartSite. If your zip file goes over the size limit allowed by SmartSite, break up the project into multiple zip files (lastname_firstname1.zip, lastname_firstname2.zip, etc) and submit these. Also submit a directions.txt file explaining how to recombine the zip files, and email the TA letting him know that you have had to do this.
The final project will be graded using the latest version of Mozilla Firefox. Note that there is a penalty of 10% per day for late submissions. For the submission, your project should be able to do the following tasks:
Project 1 Required Tasks
- Display an overview of the dataset that visualizes one or more major data dimensions of it.(15% of the project.)
- Allow users to see a more detailed view of the data by some sort of interaction such as filtering or highlighting the main overview, drilling down, or linking/navigating to another view. This should show a subset, highlight, or dimensionally orthogonal view of the data, when compared to the main overview. (15% of project)
- Have a view that can be used to analyze or show interactions that occur between players (Chat, KilledBy). Do this one of four ways (or alternatively propose and implement your own): 1) Select two players and see their interactions 2) Select a single player and show the interactions with other players. 3) Select a server and show the user interactions that occur on that server. 4) Select one of the two interaction events and show data for all users/servers for that event. (10% of project.)
- Let a user interactively specify the time range to show the data over (i.e., between a chosen start_t and stop_t). (5% of project.)
- Include a readme.txt in the submitted zip file. It should contain the following bits of information:
- The names of all team members, and a workload breakdown for each.
- Any referenced libraries that you use (such as jQuery, etc) and what you use them for.
- A brief explanation of the main implemented views/interactions: what they show, instructions for usage (as a novice user, how would I use your system?). Also state why these were chosen.
- Note any insights that may be gleaned through the system that may not be intuitive from the dataset alone, and/or any any interesting findings that you have made.
- Extra credit justification, if you feel it is deserved.
- Include the cover.png screenshot file in the submitted zip file. (5% of the project.)
- The project files are formatted and zipped correctly as described above. (5% of project.)
The idea behind the tasks is that a user should be able to use your visualization to answer research questions about the data, such as:
- What is the overall view of the data? Does one event, server, etc, dominate the data or are there equal distributions of its aspects?
- What does a user's events look like? What events does he mainly do, and how does he interact with other users?
- What are the main events for a user or for a server? How do these compare to another server?
- Are there patterns in the data? Between servers, in users, in events?
Extra Credit
Up to 20% EXTRA CREDIT may be awarded for going beyond the initial tasks or implementing exceptional visualization design and interaction. You can do this by investigating one or more additional research questions or adding additional functionality or interactivity. If you feel your project warrants extra credit, include a description of why in your submitted readme file (what you did, the questions pursued, additional functionality implemented, etc). Consider some of the following research questions or system interactions, but note that these are by no means complete. Maybe your team will want to investigate something that we haven't thought of, that's great! Extra credit is based on our discretion and your ability to pursuade us you deserve it. I.e., doing something more in-depth or thoroughly will impress us more, merely doing a minimal amount or work or in shoddy manner will be considered accordingly.
- Add functionality to search, sort, or filter servers/users/event patterns. (For example, which servers were the bloodiest based on KilledBy events? Which user built the most? Which servers were the busiest?).
- Have multiple views linked together, where updating or interacting with one view is reflected by a change in the other view. For example, if you filter a detailed view that shows data for a single server, then that filter might be applied to a view that shows the overall dataset.
- Investigate the social aspects of the game, based on multi-user events (Chat and KilledBy actions). Do they form some sort of network? Can they be categorized or aggregated?
- What do user gameplay patterns look like? Do some users only play a little bit every day? Are there binge users? Totally random? Also, do some players just fight? Or are they mainly builders?
- How does player activity vary across servers?
- Do some events cause other events? E.g.: BlockBreak, Cobblestone leads to CraftedItems, Furnace. Maybe there are patterns of events, where one event usually leads to another event taking place.
Project 2: Visualizing an NBA players dataset using Processing (25%)
Assigned: 1/29
Milestone: 2/10 11:55pm (electronic submission)
Due: 2/19 11:55pm (electronic submission)
NBA Movement Overview:
Similarly to the first project, we focus on learning a new visualization language by analyzing a dataset, this time focusing on animating motion data. The objective of this project is to use the visualization library Processing for presenting and analyzing NBA movement data. Starting in 2014, the NBA now tracks player and ball movements over the course of basketball games. This data can be discretized into "events," which is a subset of a basketball quarter where some significant play or action happens (such as a shot, steal, etc). Here's an example link to an event.
Processing is often used for rapid protoyping and in instances where heavy GPU programming is not required. It is much quicker to build visualizations using Processing than libraries like OpenGL, though this can come at a cost of computational efficiency. Additionally, lots of graphics and animation functionalities are provided as includable libraries. While these plugins may be used, you are encouraged to design and implement your own visualization and interaction. Document what is implemented by you, and what you are leveraging from libraries.
Data
We have collected events from the 2014-2015 NBA season's playoffs (won by Golden State) and broken it up into four files. The data is downloadable from here: nba1.zip, nba2.zip, nba3.zip, and nba4.zip. Here's a screenshot showing the full dataset's folder hierarchy.
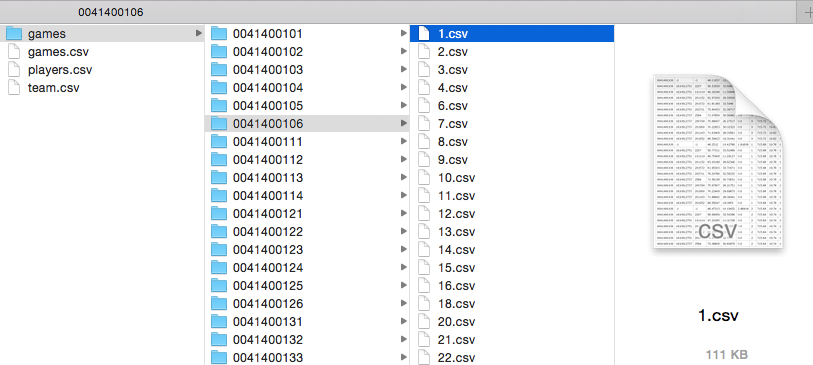
nba1.zip contains the dataset's root folder with three csv files: teams.csv, players.csv, and games.csv, and a folder called games/, which contains subfolders that each correspond to a single game. nba1.zip has about 20 games, while nba[2,3,4].zip contain additional game subfolders that can be placed in the games/ folder.
teams.csv stores the team ids and names.
| teamid | name | abbreviation |
|---|---|---|
| 1610612749 | Milwaukee Bucks | MIL |
| 1610612741 | Chicago Bulls | CHI |
| 1610612739 | Cleveland Cavaliers | CLE |
| 1610612744 | Golden State Warriors | GSW |
players.csv stores the player information. teamid maps to the teams.csv.
| playerid | firstname | lastname | jerseynumber | position | teamid |
|---|---|---|---|---|---|
| 201166 | Aaron | Brooks | 0 | G | 1610612741 |
| 201565 | Derrick | Rose | 1 | G | 1610612741 |
| 203926 | Doug | McDermott | 3 | F | 1610612741 |
| 201149 | Joakim | Noah | 13 | C | 1610612741 |
| 2200 | Pau | Gasol | 16 | F-C | 1610612741 |
games.csv stores the game information. hometeamid and visitorteamid map to the teamid field in teams.csv. gameid is the primary key for this table.
| gameid | gamedate | hometeamid | visitorteamid |
| 41400101 | 4/19/15 | 1610612737 | 1610612751 |
| 41400102 | 4/22/15 | 1610612737 | 1610612751 |
| 41400103 | 4/25/15 | 1610612751 | 1610612737 |
| 41400104 | 4/27/15 | 1610612751 | 1610612737 |
| 41400105 | 4/29/15 | 1610612737 | 1610612751 |
| 41400106 | 5/1/15 | 1610612751 | 1610612737 |
| 41400111 | 4/19/15 | 1610612739 | 1610612738 |
Subfolder names in the games/ folder are named based on the gameid field in the games.csv file. Within each individual game folder, there are a number of event.csv files, which are the game's movement events. These files are mostly ordered and named according to their place in the game (1.csv, 2.csv, etc). Each file correspondes to one discrete event. We note mostly ordered here because there may be skips in the file names, as some game events (such as free throws) do not have movmenent. Some event.csv file names are also out of order, for example, in game 0041400222, the last file is 508.csv, but this refers to an event from the 3rd quarter. 503.csv is the The event file that referes to the last play of the game. The event.csv files are formatted in the following way:
event.csv files: gameid maps to the gameid in games.csv. teamid maps to the teams.csv, it will either be the game's home or visiting team id from games.csv. Each event is composed of 11 objects, which are the 10 players on the court (playerids from the players.csv) and the basketball (which has playerid=-1). xpos and ypos are the spatial coordinates of the objects. height is the basketball height (for players it is set to 0). The moment field denotes the timestep within the current event, starting at 0. gameclock is the amount of time left in the current period (there are 4 quarters in the game). shotclock is the time remaining on the shot clock (goes from 25 to 0).
| gameid | teamid | playerid | xpos | ypos | height | moment | gameclock | shotclock | period |
|---|---|---|---|---|---|---|---|---|---|
| 41400122 | -1 | -1 | 75.6878 | 25.148 | 1.92084 | 0 | 80 | 24 | 1 |
| 41400122 | 1610612741 | 2200 | 74.42645 | 25.16516 | 0 | 0 | 80 | 24 | 1 |
| 41400122 | 1610612741 | 2399 | 83.77002 | 16.54016 | 0 | 0 | 80 | 24 | 1 |
| 41400122 | 1610612741 | 201959 | 84.94239 | 33.34648 | 0 | 0 | 80 | 24 | 1 |
| 41400122 | 1610612741 | 201565 | 64.28913 | 2.2195 | 0 | 0 | 80 | 24 | 1 |
| 41400122 | 1610612741 | 202710 | 65.2853 | 32.35874 | 0 | 0 | 80 | 24 | 1 |
| 41400122 | 1610612749 | 201162 | 87.63311 | 16.60573 | 0 | 0 | 80 | 24 | 1 |
| 41400122 | 1610612749 | 203089 | 88.12192 | 33.50131 | 0 | 0 | 80 | 24 | 1 |
| 41400122 | 1610612749 | 203114 | 66.03438 | 16.61962 | 0 | 0 | 80 | 24 | 1 |
| 41400122 | 1610612749 | 203487 | 81.82388 | 16.38422 | 0 | 0 | 80 | 24 | 1 |
| 41400122 | 1610612749 | 203507 | 67.71773 | 36.8256 | 0 | 0 | 80 | 24 | 1 |
| 41400122 | -1 | -1 | 75.68427 | 25.13309 | 1.75055 | 1 | 80 | 24 | 1 |
| 41400122 | 1610612741 | 2200 | 74.42295 | 25.16762 | 0 | 1 | 80 | 24 | 1 |
| 41400122 | 1610612741 | 2399 | 83.7643 | 16.53899 | 0 | 1 | 80 | 24 | 1 |
| 41400122 | 1610612741 | 201959 | 84.89382 | 33.35325 | 0 | 1 | 80 | 24 | 1 |
| 41400122 | 1610612741 | 201565 | 64.27988 | 2.2075 | 0 | 1 | 80 | 24 | 1 |
| 41400122 | 1610612741 | 202710 | 65.25536 | 32.32648 | 0 | 1 | 80 | 24 | 1 |
| 41400122 | 1610612749 | 201162 | 87.6373 | 16.60444 | 0 | 1 | 80 | 24 | 1 |
| 41400122 | 1610612749 | 203089 | 88.13199 | 33.50475 | 0 | 1 | 80 | 24 | 1 |
| 41400122 | 1610612749 | 203114 | 66.03944 | 16.59565 | 0 | 1 | 80 | 24 | 1 |
| 41400122 | 1610612749 | 203487 | 81.82347 | 16.38102 | 0 | 1 | 80 | 24 | 1 |
| 41400122 | 1610612749 | 203507 | 67.73624 | 36.84982 | 0 | 1 | 80 | 24 | 1 |
Implementation
This project is to be created using Processing. Underlying libraries (both Processing and Java-based) may be used, but must be noted in the submission's readme.txt doc, and the jar files included in the submitted folders. Make sure that if you use external libraries, you reference them correctly (i.e., locally)! Try testing the application on another computer to make sure it works.
Consider again using data pre-processing if you want to analyze the data in different ways. The data has been pre-formatted to make it easy for loading and animating individual events, but other forms of analysis and visualization might require data processing. Think about good ways to break up the data for presentation, interaction, analysis, and investigating different tasks, and prepare accordingly.
Milestone
This is similar to project 1's milestone. Create a short video (under 1 minute) showing you can animate an event (the first task). In addition to this, show that you can drag the slider bar with a mouse to manually tweak the event's animation (third task). This proves that you are able to load the data and visualize it very straightforwardly, as well as interact within a Processing environment. Feel free to show any other interactions or views you are working on, but this is not required. Audio narration is again allowed, though not required. Name the video lastname_firstname.move (or .mp4) like project 1's video, and include a readme.txt narrating what you are showing. Also include a screenshot of your current system called cover.png. These three files will be uploaded via SmartSite. (10% of project.)
Completed Project
The project will be submitted through SmartSite. There is a 10% per day penalty for late projects. Since this is a large dataset, you won't be able to include it in the submission to SmartSite due to file size restrictions. For this reason, do not include the original data files in your submitted project's zip file. Remove them before submission, and we will add them back in when I test your project. You will however need to include any derived or new data files, if you create them. For testing, we will assume that the original data files are locally referenced starting at ./data/. For example, reference the games.csv file simply as data/games.csv, and reference an individual event.csv file like data/games/[some gameid]/[some eventid].csv. If this is not the case, please state so in the readme.txt. If size is still an issue, you may consult the TA for help making the submission.
This project will be tested by running the main method in main.pde file via the Processing IDE. Do not format your project where for each separate task, different *.pde files must be run. Only main.pde will be run. Include the following files in your submitted project:
- Zip the files into a compressed file named lastname_firstname.zip, as in project 1.
- The main pde file to be run should be called main.pde. Place it in your zip's root.
- Include all referenced jar files, images, derived data files, etc in your zipped file. I recommend you place referenced jar files in a ./lib/ folder, and derived data files in a folder like ./data2/
- Include a screenshot of your system called cover.png, and your readme.txt file. These should be in the zipped file's root.
Project 2 Required Tasks
Your completed project should be able to do the following:
- The user can select an individual event and play it as an animation. (15% of project.)
- For a currently selected event, be able to show some additonal information. This may take the form of aggregate / summarization information: things like pictures or details of the players / teams involved or the particular game selected, aggregate total movement data, statistics about distance traveled, average speed, or ball possession. See this page for how to compute some of those. But use your imagination and don't feel limited to only those types of data views and statistics. For example, you could show the event in reference to other events for the current game, or to other events with the currently selected teams, etc. (10% of project.)
- Let the user drag a slider to manually navigate through the loaded event. Also be able to pause the playback, or go back to the beginning. (10% of project.)
- Select an individual player or team from the currently loaded event and see some detailed information about that player / team. This should be more than just showing his name / number / team / picture, etc, think of some interesting information to explore or present, such as additional events they are in, statistical information about the currently selected event, etc. (10% of project.)
- Include a readme.txt in the submitted zip file. It should contain the following bits of information:
- Your name.
- Any referenced libraries (jar files, etc) or additional datasets that you use and what you use them for.
- A brief explanation of the main implemented views/interactions: what they show, instructions for usage (as a novice user, how would I use your system?). Also state why these were chosen.
- Note any insights that may be gleaned through the system that may not be intuitive from the dataset alone, and/or any any interesting findings that you have made.
- Extra credit justification, if you feel it is deserved.
- Include the cover.png screenshot file in the submitted zip file. (5% of the project.)
- The project files are formatted and zipped correctly as described above. (5% of project.)
Extra Credit
Similarly to Project 1, up to 20% EXTRA CREDIT will be available for this project. Credit will be given to particularly impressive designs and/or interactions, or exploring more research questions. Some possible ideas to pursue include:
- Show aggregate event information. Can events be classified based on players that they contain, their time length, when they occur in a period, or the movement patterns they contain? Is there a way to display more than one event in a single visualization (an overview of the whole dataset), and from there drill down to individual events?
- Integrate additional data sources. For example, you can retrieve the play-by-play data for an entire game using the gameid as a json file: http://stats.nba.com/stats/playbyplay?GameID=0041400402&StartPeriod=0&EndPeriod=14. This file also shows events that don't contain movement, such as free throws. With data like this, you would be able to generate game-level charts (see here for some examples) and do more advanced event analysis.
- Implement a telestrator-like annotation or overlay for showing the movements, behaviors, or highlights during an event. For broadcast sports, this is usually done by a commentator freehand-sketching over a video or freeze-frame image. Here's an example image of it.
- Is there a way to compare players against each other or analyze behavior patterns, based on events they are a part of? Or maybe based on player positions or roster composition for movements. Do certain players tend to always have the ball? Which ones pass it the most, and which shoot it?
Final project: Visualizing a data set of your choice (25%)
Assigned: 2/20
Proposal due: 2/27, 11:55 pm (electronic submission)
Presentation: 2/29 in class
Final project and writeup due: 3/13, 11:55 pm (electronic submission)
Interactive demos to the instructors: 3/15
Description:
In this assignment, you will apply the data visualization and interaction ideas discussed in lecture, and the skills learned in the previous two projects, to a data set of your choice. You will present your ideas to your peers in a clear and concise manner, and you will demo your project for the instructors. In this project, you are optionally allowed to work in teams of either 2 or 3. However, the work produced must reflect the team size. If you work as a team, your proposal, in-class presentation, and final write-up must include a breakdown of the work done by each team member.Data:
You are responsible for finding your own data set this time. Pick something that you're curious about, and that you believe will produce interesting visualizations. The data set should be rich, containing at least 4 related attributes.You may choose to continue working with one of the data sets from Project 1 or Project 2. However, if you do, you are encouraged to seek for additional data from an external source to enrich your visualization. We will also expect your project to be much more well-developed, since you are starting from an already-completed project.
Here are some ideas (although we encourage you to find your own!), along with possibly interesting attributes of each dataset:
- Download your Facebook data (timeline posts, friends list, events, messages): http://www.facebook.com/help/131112897028467/
- Download a dump of Wikipedia (articles, images, links between articles, edit history, article discussion, user activity): http://dumps.wikimedia.org/
- Download one or more monthly dumps from Stack Exchange, a question-and-answer website (# of questions in each category over time, # of upvotes or downvotes per question or category, # of answers or comments per question or category, tag frequency, keyword frequency in questions and answers, user activity): http://www.clearbits.net/creators/146-stack-exchange-data-dump
- Download a dataset from Google's Ngram Viewer, basically counts of phrases from over 20 million books.
- Check out the various multivariate datasets available from UC Irvine's Machine Learning Repository.
In particular, the cars dataset has been used in many high-dimensional visualizations, such as parallel coordinates.
- Browse a list of datasets available online at datawrangling.com.
- Download a Twitter dataset. Here's a dump of tweets from 6/2009. It contains over 18 million tweets, about 990 MB compressed. The accompanying paper and the network of followers are available here.
- A list of datasets mostly from visualization contests: http://www.cs.ucdavis.edu/~ma/ECS289/datasets.html
Proposal:
You will submit a proposal (Word document, ~2 pages single spacing, 12pt Times New Roman font, including images) describing the data set you've chosen, and how you plan to visualize it. The purpose of your proposal document is to give a high-level description of what you plan to do: what will your application look like and what is its purpose? What interesting questions can you ask about the data set? How will you use visualization to answer them? Specifically, describe how you will use shape, color, size, connections, position, movement, and other visual channels to render different aspects of the data.Also consider how interaction will play into your visual design. What visualization parameters will be under user control? How can you let your users easily navigate and sift though this data set? What interaction is important and why?
The proposal will prepare you for the final project, in which you will implement your ideas. That being said, it is expected that your design will change somewhat during the course of implementation.
You must state how tasks are divided among project members.
In-class presentation:
You will also create and give a short presentation (HTML or Powerpoint, ~2 minutes) summarizing the data set and detailing your visual design and expected interaction. Your presentation should show pictures (hand drawn, computer-generated, etc.) which clearly convey your visual idea. Further, you must discuss your intended interaction and how your complete package will answer "interesting" questions.You will present your design to the class. Your overall goal is to convince me, and the rest of the class, that your visualization is good for the data set and the work allocations are reasonable.
Final writeup:
To describe and document the design of your project, you will submit a final writeup (Word document, ~4 pages single spacing, 12pt Times New Roman font, including images). This writeup will be an extension of your initial project proposal; it can include the original proposal, to show what you initially set out to do, or it can further develop the proposal and add more detail. Your writeup is an important part of your final project, so it should a be well written, formatted, and professional-looking report.The final project writeup should include:
- A description of the data and its relevance; that is, what you are trying to visualize, and why you want to visualize it
- How you initially proposed to visualize the data, and why you wanted to visualize it that way
- How the visualization changed throughout the design / implementation process, things you tried that worked and things that didn't, what you have learned from doing this project
- Justifications and explanations for changes and design decisions
- A description of the final visualization, including implementation details, visual encodings, and interactions
- How tasks are divided among project members.
Requirements and grading:
You will implement the design that you proposed to me and presented to the class. Again, this system should enable us to answer questions that would require exhaustive effort if done with conventional spreadsheet browsing or database queries. This project has much room for creativity. Your objective is to impress me by making a highly interactive and visually appealing system that is useful and provides new insight in the data.Specifically, you are expected to accomplish the following:
- Project proposal (turned in by the due date) (Up to 10% of the project)
- In-class proposal presentation (up to 5% of project)
- Display a graphical view of the data (10% of project)
- Interactive selection of a subset of the data and display of this subset in an alternative, more detailed, graphical view. (up to 10% of the project)
- Implement at least 2 of the following features: pan and zooming on at least one of the views, link the overview and detail views together (using mouseovers, drawing connections, seelctions, etc), implement interactive visual querying and exploration, show your action history via an interactive breadcrumb, use animation or transitions to help users better understand the data and/or preserve cognitive mappings, implement an interactive breadcrumb- or history-like view for system provenance. Alternatively, you can propose your own system augmentations or features in your proposal and get approval to fulfill this task. (Up to 15%)
- Overall system design and interaction flow (Up to 30%)
- Final project writeup (Up to 15%)
Extra credit (up to 20%) will be given similarly to Projects 1 and 2, for systems that demonstrate strong system and visual design and implementation or do particularly interesting data analysis. Additionally, we will also consider extra credit for two following two features: 1) being able to interactively re-map color, shape, and/or size for selected attributes, and 2) having the ability to save the visualization state as a sequence of user interactions, and replay the interactions from the saved state.
Note that if you are using a dataset/application from Project 1 or 2, you may re-use components or build on the existing system, but there must be sufficient changes made to the original project to show that you (or your team) has done an appropriate amount of work for Project 3. You should detail how you are changing the system in your project proposal, and will have to justify that it is appropriate.