
Research Highlights
|
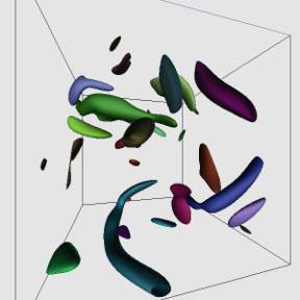
We introduce the concept of "learn to track". This project studies learning-based feature extraction and tracking techniques for visualizing time-varying volume data. We have developed a volume feature tracking technique, using an intelligent region growing approach that is more flexible and powerful than previous methods because machine learning allows us to use a self-modifying region growing criteria, as well as high-dimensional data in a potentially complex tracking problem. Contact: Kwan-Liu Ma
Publications: |
 |
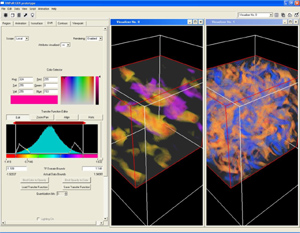
In order to obtain useful insight from large-scale time-varying simulation data, it is very important to put human in the loop when interpreting and analyzing the data. To achieve this goal, we have designed novel user interface with a goal to assist the navigation of features in various spatial and temporal scales. The interface consists of multiple coordinated views that support interactive and flexible navigation through the multi-resolution spatio-temporal data hierarchy by providing key features such as brushing and linking, and focus and context. The interface not only works well with traditional level-of-detail selection methods, but also gives the user full control over the level-of-detail selection by helping the user glean insight into the data and thus making effective and efficient level-of-detail decisions in an informed manner. This greatly enhances the visual data exploration and facilitates the interactive multi-resolution volume rendering of large data sets. Contact: Han-Wei Shen
Publications: |
 |
The VAPoR software development project is a collaboration between NCAR and U.C. Davis that aims to bridge the gap between the time when research results are published, and when these results find application in user tools. By working closely with our visualization research partners at U.C. Davis, and in the future, Ohio State University, we can leverage, and in some cases influence, their areas of study, and greatly facilitate and accelerate the integration of novel, advanced algorithms into the VAPoR framework. The VAPoR effort addresses the needs of a specific group of application domain scientists, namely those conducting numerically simulated turbulence experiments in the natural sciences. The outputs of these numerical experiments are time-varying data sets that are often terabytes in size. An overreaching goal of VAPoR is to provide a professional quality, state-of-the art, advanced visualization application that targets the scientific end user as well as the more conventional user, the visualization specialists. Meeting this objective requires stressing ease-of-use features essential to the adoption of the application by non-experts, and not generally found in traditional visualization packages. To further serve the needs of the scientific end user, the tool also incorporates non-visual, quantitative investigation capabilities that area necessary for rigorous data analysis. Ultimately the VAPoR code will be licensed and released as OpenSource to visualization community, providing a framework upon which other groups can test new ideas or develop new domain specific applications. Contact: John Clyne |
 |
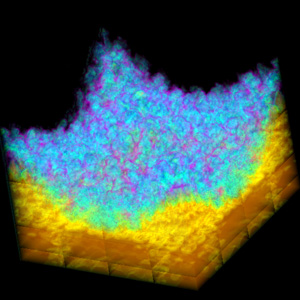
This is a collaboration between NCAR and UC Davis aiming to help NCAR scientist to visualize the terascale time-varying volume data from solar convection simulations. We have developed a data reduction approach coupled with hardware-accelerated data unpacking and rendering specifically for non-uniform grid volume data. Data reduction is achieved by packing only those regions of interest specified by the user through an intuitive visual interface. The packed data can be transferred between disk, main memory, and video memory more efficiently. Data unpacking and interactive rendering of the non-uniform grid data are done on GPU, leading to more effective data exploration in both spatial and temporal domains. Contact: Kwan-Liu Ma
Publications: |
 |
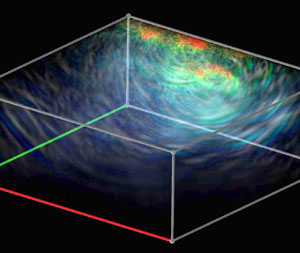
We have developed a new framework for managing and rendering large scale time-varying data using the wavelet-based time-space partitioning (WTSP) tree. We utilize the hierarchical TSP tree data structure to capture both spatial and temporal locality and coherence of the underlying time-varying data and exploit the wavelet transform to convert the data into a multiresolution spatio-temporal representation. Coupled with the construction of TSP tree, a two-stage wavelet transform process (3D+1D) is applied to the data in the spatial and temporal domains respectively at the preprocessing step. During rendering, the wavelet-compressed data stream is decompressed on-the-fly and rendered using 3D hardware texture mapping. WTSP tree allows random access of data at arbitrary spatial and temporal resolutions at run time. The user is provided with flexible error control of image quality and rendering speed tradeoff. We demonstrate the effectiveness and utility of our framework by rendering gigabytes of time-varying data sets on a single off-the-shelf PC. Contact: Han-Wei Shen
Publications: |
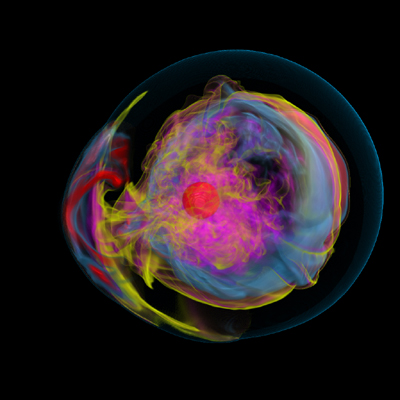 |
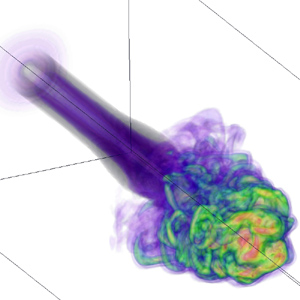
We are working with TSI sicentists to develop scalable, interactive visualization solutions for improved understanding of terascale data from the modeling of supernovae. An important requirment is the ability to make high fidelity visualizations. Contact: Kwan-Liu Ma
Publications: |
 |
We have developed a new parallel multiresolution volume rendering algorithm for visualizing large data sets. Using the wavelet transform, the raw data is first converted into a multiresolution wavelet tree. To eliminate the parent-child data dependency for reconstruction and achieve load-balanced rendering, we design a novel algorithm to partition the tree and distribute the data along a hierarchical space-filling curve with error-guided bucketization. At run time, the wavelet tree is traversed according to the user-specified error tolerance, data blocks of different resolutions are decompressed and rendered to compose the final image in parallel. Experimental results showed that our algorithm can reduce the run-time communication cost to a minimum and ensure a well-balanced workload among processors when visualizing gigabytes of data with arbitrary error tolerances. Contact: Han-Wei Shen
Publications: |
 |
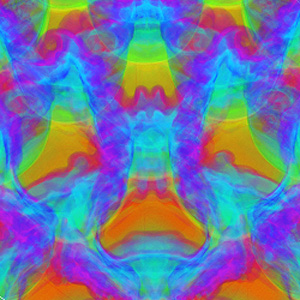
In this work, we have developed a parallel adaptive volume renderer which makes possible the interactive visualization and improved understanding of large-scale earthquake simulations. We have also introduced a temporal filtering technique to enhance the wave propagation and reveal the wave dynamics. The resulting temporal-spatial animations help scientists better understand how the seismic wave travels towards the free surface. Contact: Kwan-Liu Ma
Publications: |
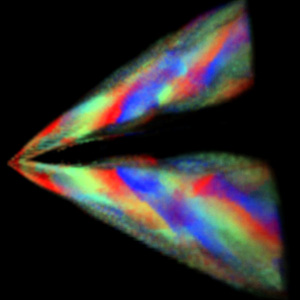 |
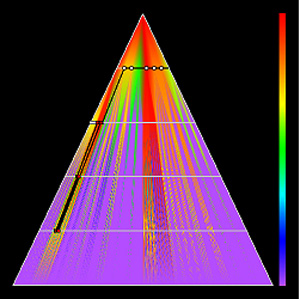
This research investigates alternative methods for viewing time-varying volumetric data. We consider such data as a four-dimensional data field, rather than considering space and time as separate entities. If we treat the data in this manner, we can apply high dimensional slicing and projection techniques to generate an image hyperplane. The user is provided with an intuitive user interface to specify arbitrary hyperplanes in 4D, which can be displayed with standard volume rendering techniques. From the volume specification, we are able to extract arbitrary hyperslices, combine slices together into a hyperprojection volume, or apply a 4D raycasting method to generate the same results. In combination with appropriate integration operators and transfer functions, we are able to extract and present different space-time features to the user. Contact: Han-Wei Shen
Publications: |
 |
Tracking and visualizing local features from a time-varying volumetric data allows the user to focus on selected regions of interest, both in space and time, which can lead to a better understanding of the underlying dynamics.resent an efficient algorithm to track time-varying isosurfaces and interval volumes using isocontouring in higher dimensions.ng the data features such as isosurfaces or interval volumes separately from multiple time steps and computing the spatial correspondence between those features, our algorithm extracts the correspondence directly from the higher dimensional geometry and thus can more efficiently follow the user selected local features in time.nalyzing the resulting higher dimensional geometry, it becomes easier to detect important topological events and the corresponding critical time steps for the selected features., the user can interact with the underlying time-varying data more easily.for performing time-varying volume tracking is also minimized. Contact: Han-Wei Shen
Publications: |