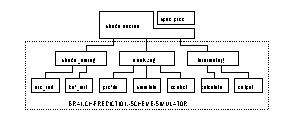
Figure 1. Shade-Based Branch Prediction Scheme Simulator
1. Experimental System
Our experiment is conducted on SPARC system 10 with two SuperSparc/60 V8 micro-processors. We compiled c benchmark programs using SUNSoft "cc" version 3.0.1, and compiled fortran programs using SUNSoft "f77" version 3.0.1.
Our data is obtained using "Shade"[SHADE] version 5.15 analyzing programs. Shade is a dynamic code tracer. It links instruction set simulation, trace generation with custom trace analysis. The first advantage of a shade-based simulator over other static trace-based simulators such as pixie based approach is its fast running speed. Shade tends to run fast mainly because the executable being traced, the shade trace generator, and the shade analyzer are all in one single process. The second advantage is that it combines trace generation and trace based analyzer/simulator, thereby avoiding awkward trace file manipulations.
The following figure illustrates the code structure of our shade-based branch prediction simulators.

Figure 1. Shade-Based Branch Prediction Scheme Simulator
2. Benchmark Programs
In different applications and programming languages, conditional branches behave differently. It is important to have a set of benchmark programs that can give a good approximation of the average workload and complexity of the programs that users run. Previous work in this area has been done by tracing the execution of some benchmark programs. In this project, we also use instruction tracing data to measure the performance of different branch prediction schemes. Eight benchmark programs from the beta version of SPEC95 integer program suite and thirteen benchmarks from the SPEC92 floating point program suite are used in this study. Table 1 and 2 list the benchmark programs, their abbreviations that we use, and the testing input data sets used in our experiment.
| SPEC95 Integer Program Beta | ||||
|---|---|---|---|---|
| Benchmark / Input | Dynamic Inst. | Dynamic Cond. Branch | Program / Input size | Static Cond. Branch |
| gcc / 1amptjp.i | 1297M | 221M | 1697K / 222K | 19598 |
| gcc / 1c-decl-s.i | 1297M | 221M | 1697K / 222K | 19603 |
| gcc / 1dbxout.i | 1664M | 28M | 1697K / 42K | 15455 |
| gcc / 1reload1.i | 992M | 173M | 1697K / 148K | 19673 |
| gcc / cccp.i | 1298M | 223M | 1697K / 162K | 19514 |
| gcc / insn-emit.i | 147M | 23M | 1697K / 48K | 10815 |
| gcc / stmt-protoize.i | 986M | 165M | 1697K / 185K | 19746 |
| ghost / convolution.ps-color | 1400M | 238M | 584K / 218K | 4262 |
| ghost / convolution.ps-mono | 1342M | 229M | 584K / 218K | 4312 |
| ghost / convolution.ps-tiff | 1315M | 222M | 584K / 218K | 4330 |
| go / restart.in* | 4535M | 500M | 390K / | 5761 |
| go / neardone.in | 733M | 78M | 390K / | 4874 |
| go / null.in* | 4531M | 500M | 390K / | 5742 |
| m88ksim / dcrand.in* | 7007M | 1000M | 389K / 66K | 824 |
| numi / numi.in* | 7507M | 1000M | 31K / | 1064 |
| li/li-input.lsp* | 12355M | 1000M | 299K / | 1412 |
| perl / jumble.perl* | 3471M | 500M | 400K / | 2523 |
| perl / primes.perl* | 4762M | 500M | 400K / | 2218 |
| vortex / vortex.in* | 7195M | 1000M | 867K / | 7602 |
Table 1. SPEC95 Integer Program Beta and Input Data Description.
| SPEC92 Floating Point Program | ||||
|---|---|---|---|---|
| Benchmark | Dynamic Inst. | Dynamic Cond. Branch | Program size | Static Cond. Branch |
| alvinn | 6792M | 480M | 9612 | 1032 |
| doduc | 1644M | 87M | 247K | 2330 |
| ear | 14506M | 705M | 59K | 1238 |
| fpppp | 8463M | 106M | 138K | 1332 |
| hydro2d | 6627M | 680M | 111K | 2356 |
| mdljdp2 | 4206M | 309M | 79K | 1458 |
| mdljsp2 | 3011M | 338M | 98K | 1520 |
| nasa7 | 11104M | 217M | 91K | 1889 |
| ora | 2029M | 158M | 24K | 1153 |
| su2cor | 8055M | 165M | 150K | 1863 |
| swm256 | 9862M | 66M | 62K | 1335 |
| tomcatv | 1261M | 31M | 21K | 1036 |
| wave5 | 4331M | 286M | 401K | 1956 |
Table 2. SPEC92 Floating Point Program Description.
3. Branch Prediction Scheme Design
Branch prediction schemes using small buffers of branch history take advantage of the repetitive branch taken/untaken execution behavior, thereby achieving better prediction accuracy than the simple static prediction schemes. For each conditional branch, an appropriate counter is incremented or decremented. The most significant bit of the counter determines the prediction decision. J. Smith [S81] observed that a 2-bit counter empirically provides an appropriate amount of damping to changes in branch direction. A 1-bit counter simply records the last executed branches direction. In addition, 3-bit or higher counters do not appear to offer large cost/benefit advantages over 2-bit counters. We will further discuss the design of 2-bit counter in a later subsection on predictor tuning.
Bimodal branch prediction is the simplest 2-bit counter based dynamic prediction scheme. The branch history table is indexed by the low order address bits in the program counter. The following table illustrates the design of the bimodal prediction scheme.
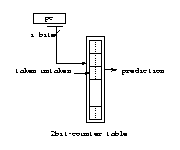
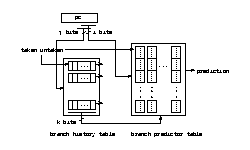 Figure 2, 3. Bimodal Predictor |
Correlation Based Predictor
Correlated branch prediction schemes include common-correlation, gselect, global and local. Since the bimodal scheme takes advantage of the bimodal distribution of branch behavior, it does not perform well when branches have strong dynamic behavior. Correlated prediction schemes are designed to take advantage of relationship between different branch instructions -- certain repetitive branch pattern of several consecutive branches. One correlation based predictor uses two branch history tables. The first table records the history of recent branches -- global history. Each entry is implemented using a shift register. The second table records the branch history for each branch. It is organized as a matrix with rows and columns. Each entry is a 2-bit counter. The pc determines which shift register in the first table and which row of the 2-bit counters of the second table should be used. The chosen global shift register indexes the appropriate counter from the selected row of counters. Prediction is made based the selected counter. The selected shift register and the 2-bit counter will be updated afterwards accordingly. Figure 3 above illustrates the design of correlated schemes.
There are many ways of using pc to index the first and the second tables. Yeh and Patt [YP93] classified these methods into per_address which uses the low order bits of pc and per_set which uses high or middle range bits of pc. They claimed that per_address method and per_set method have similar performance, and the latter has higher implementation cost. We use per_address in our study.
The well-known common-correlation scheme is a correlated scheme that uses a single 2-bit shift register as the global branch history table, and four 2-bit counter for each row of the second table. The 2-bit shift register approach only exploits the correlation between two consecutive branches. Another similar correlated scheme design uses j > 2 bits for the global branch history register and 2^j 2-bit counters for each row of the second table. We adopt the name used by McFarling and refer to it as the gselect scheme. If i equals to 1, i.e. there is just single row in the second table, the scheme is also referred to as the global scheme. Global scheme applies all its buffer for recording the correlation information while ignoring the different branch behavior of a single branch. In most cases, it does not perform as well as other correlated schemes.
More complicated design uses multiple shift registers in the first table. Each register records the branch history of different branches. McFarling referred to it as the local scheme.
Sharing index scheme is referred to as gshare. It was proposed by McFarling. This scheme is similar to the bimodal scheme. It xors a j bits global history shift register with the i bits of the pc before indexing the counter table. Figure 4 illustrates the design of the gshare scheme.
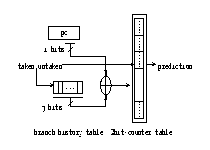
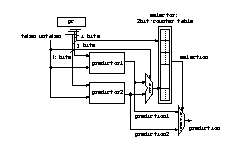 Figure 4, 5. Index Sharing Predictor | Selective Predictor
Different dynamic schemes use different branch history information. Many schemes work well on one type of programs and do not work well on another type of programs. The selective scheme uses two different predictors. Each of two predictors makes prediction independently. A third table is used to track the performance of the two subpredictors and arbitrates which prediction should be used as the final prediction. Selective scheme can perform well on different types of programs. Figure 5 illustrates the design of the selective prediction scheme.
The implementation cost of the selective prediction scheme is three times of the implementation cost of other prediction schemes because two predictors and one selector are used.
The implementation costs of different schemes are shown in the following table. In the table, i is the number of pc bits for indexing the counter table row, j is the number of pc bits for indexing the shift register table, and k is the number of bits of the shift register
| scheme name | i | j | k | buffer size |
| bimodal | variable | n/a | n/a | 2*2^i |
| correlation | variable | 1 | 2 | 1 + 2*4*2^i |
| gselect | variable | 1 | variable | k + 2*2^(i+k) |
| global | 1 | 1 | variable | k + 2*2^k |
| local | variable | variable | variable | k*2^j + 2*2^(i+k) |
| gshare | variable | n/a | variable | k + 2*2^i |
Table 3. Dynamic Predictor Implementation Cost
Before gathering data for all the benchmark programs, we applied a small set of programs to come up with the best parameters for each scheme. We tested different 2-bit count designs, different correlation depth for the gselect and local, and different global bits for gshare.
To have a fair comparison, we choose 8K bits branch prediction buffer, i.e. 4K 2-bit counter entries, for all of the prediction schemes. We will discuss the effect of buffer size on prediction accuracy further in the result analysis section.
There are many variations in the design of the 2-bit counter state transition automaton. Figure 6 shows four common automaton designs. The two most well-known are automaton1 and automaton2. Assuming that automaton1, discussed in Patterson and Hennessy's book , has better performance, we used automaton1 first. However, according to our experimental results, automaton2 based schemes produced about 0.5% better prediction accuracy then those based on automaton1 when 8kb buffer was used. Used by many prediction schemes, automaton2 is also referred to as a saturating up-down counter. We choose automaton2 based schemes in our final comparison analysis. Automaton3 and automaton4 are similar to automaton2. Their state transition is in more favor of branch taken tendency.
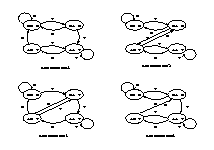
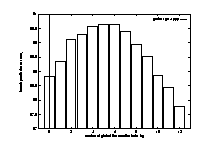
Figure 6, 7. 2bit Counter State Diagram Design
| Correlation Depth vs. Prediction Accuracy
(click each automaton for a full-sized figure)
From Figure 7 above, 5~6 global bits is the best choice when the branch prediction buffer is 8k bits. We use 5 bits in our comparison analysis since we used gcc here, and we expect fewer global bits should be used for floating point programs.
From Figure 8, we observe that the best choice is to use 3 global bits when the buffer is 8K bits.
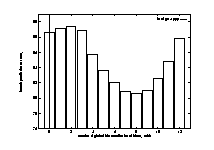
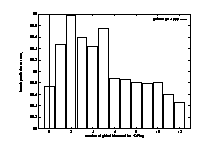
Figure 8-9. Local Scheme Correlation Depth vs. Prediction
Accuracy.
| Gshare Scheme Global Branch History Bit Adoption
vs Prediction Accuracy
From Figure 9 above, 2 global bits is best choice for 8kbit buffer case.
There are many variations in the design of selective prediction schemes. Two sub-predictors are chosen from different schemes. Given certain amount of prediction history buffer size, the three prediction history buffer may take different buffer spaces. McFarling used a gshare predictor and a bimodal predictor as the two sub-predictors. We use gselect and bimodal. Considering that it is more beneficial to have larger buffer size for gselect predictor, we use 2Kb buffer for the bimodal predictor, 4Kb buffer for the gselect predictor, and 2kb buffer for the selector. We use 3 global history bits for the gselect sub-predictor.
Providing the fast running speed of Shade, we can explore more schemes and run more programs. More importantly, we can trace much more instructions for each program. In our study, we traced most benchmark programs to the end. The regular size of a benchmark program is more than several hundred million and is getting larger. It may beyond the tracing and simulation capability of trace file based approaches to trace so many instructions. It is feasible for most trace file based approaches of trace and simulate at most several tens of million instructions. Since the branch behaviors of some programs will not show until program runs to the middle, our several hundred millions to several billions of instructions' tracing for each program is expected to provide more reliable result and more complete information about those benchmark programs.
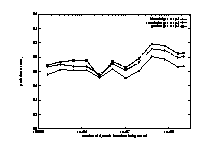
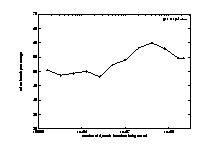
Figure 10, 11. Prediction Accuracies vs. Branch Instructions Traced
| Branch Taken Percentage vs. Branch Instruction Traced