|
|
Introduction to Computers: Fall 2013
Lab2: Advanced Excel techniques (I)
Note: Bring headphones or earbuds if you want to listen to the tutorials.
This lab is divided into two parts:
- - In part I, you will either do online
tutorials or follow demo videos supplied by Microsoft to help you better understand how to
use Microsoft Excel tools (workbooks, formulas, charts,...).
- - In part II, you will apply the knowledge you have just learned to analyze real experimental data (biological data on gene expression).
Just like in Lab1, you will have to use
Internet Explorer to run the tutorials.
If you have troubles starting the program, you may have to click the message
bar of Internet Explorer to permit the download of the ActiveX program.
You will not need to save your work as you progress through the tutorials:
your handout for this lab will be based solely on part II.
I strongly advise however that you go through the tutorials,
as it will help you solve it.
Part I: Tutorials on Advanced Excel Techniques
You have three options, based on the version of Microsoft Excel you will use:
Excel2007, Excel2010, and Excel2013.
If you are in the lab, I strongly advise that you go over the tutorials for
Excel2013, as this is the version that is available on the computers.
Option 1: Excel 2007
Goto: http://office.microsoft.com/en-us/training/CR010047968.aspx, a web page
that contains links to a list of the Microsoft Excel 2007 courses.
The three tutorials I advise you to do are:
- Get to know Excel 2007: Create your first workbook
- Get to know Excel 2007: Enter formulas.
- Charts I: How to create a chart in Excel 2007
After each tutorial, to get back to the Excel 2007 training page you can either use
the down arrow of your browser to get to the CR01… web page, or
click “Return to Training on
Microsoft Office Online”, and then select the Office 2007 tab in the Browse Training
by Product area.
Option 2: Excel 2010
Go to:
http://office.microsoft.com/en-us/excel-help/CH010369467.aspx which has a list of the
Microsoft Excel 2010 Courses.
The tutorials you can do are:
- Get to know Excel 2010: Create your first spreadsheet
- Get to know Excel 2010: Create formulas.
- How to create a basic chart in Excel 2010
After each tutorial, to get back to the Excel 2007 training page you can either use
the down arrow of your browser to get to the CR06… web page,
or click “Return to Training on Microsoft Office Online”, and then select the Office 2007 tab in the Browse Training by Product area.
Option 3: Excel 2013
Goto the URL: http://office.microsoft.com/en-us/excel-help/training-courses-for-excel-2013-HA104032083.aspx
which has a list of the Microsoft Excel 2013 Courses /videos.
The tutorials I advise are:
- Create your first Excell 2013 workbook
- Understand and use cell references
- Average a group of numbers
The training courses for Excel2013 do not contain practice sessions (just videos).
Part II: Analyzing Biological Data
A simple experiment was designed to analyse the effects of noise on gene expression
within a cell: a cell has been engineered to contain two genes (which we will label as
C and Y) that are supposed to be expressed identically.
In the presence of noise however, the expression levels will differ.
There are two possible source of noise:
- - extrinsic noise: noise related to all external factors that may affect gene expression
- - intrinsic noise: noise related to the gene expression machinery itself.
Two different experiments were conducted, each with a different type of cells.
In experiment 1, data (i.e. expression levels for C and Y) were collected for 48 cells,
while in experiment 2, data were available for 36 cells.
The raw data are available in the file: Data_Lab2.xlsx.
Your assignment:
- Download the data file Data_Lab2.xlsx. Be sure to
remember that this data file contains results for two experiments.
- Some of the data are erroneous: these correspond to cases in which either C or Y is 0. Remove those rows, for both experiments.
- Generate a plot (scattered plot) of Y as a function of C for each experiment.
- Compute the levels of intrinsic, ηint2, extrinsic, ηext2, and total ηtot2 noise in each experiment, where the noise levels are defined according to the following equations:
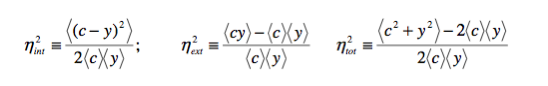
where < > stands for the average over all cells included in the experiment.
- Generate a small report using Microsoft Word. You will include in this report:
- An appropriate title (for example, "ECS15 Lab 2: Analyzing noise levels in biological experiments".
- A one paragraph description of what you did.
- For each experiment, provide the plot of Y as a function of C. Make sure that:
- Your plot has a title
- The ranges for values on the X-axis and Y-axis are the same
- You provide labels for the X and Y axes
- The data points are shown as circles
- For each experiment, provide the values of the three types of noise, ηint2, ηext2, and ηtot2 .
Finally, if you can draw any conclusions from your data, give a concluding paragraph
(1-3 sentences are enough) that includes a possible interpretation for the different types of noise.
File submission
Please submit your report as a single document (you can name
this document as you want, but do keep the .docx extension).
It is very important to turn in your assignment. If you do not turn in,
you will not get your credit.
USE SMARTSITE to save your assignment. If you are not sure how to do it, ask a TA for help.
Do not forget to logout from the lab computers!
Grading
Please look at the breakdown below that will be used for grading your assignment:
| Presentation of Word document |
4 points |
| Experiment 1, plot Y=f(C) |
7 points |
| Experiment 1, the three values ηint2, ηext2, and ηtot2 .
|
6 points |
| Experiment 2, plot Y=f(C) |
7 points |
| Experiment 2, the three values hint2, hext2, and htot2 .
|
6 points |
There is a total of 30 points for this assignment.
|