


Patrice Koehl
Department of Computer Science
Genome Center
Room 4319, Genome Center, GBSF
451 East Health Sciences Drive
University of California
Davis, CA 95616
Phone: (530) 754 5121
koehl@cs.ucdavis.edu
|
|
| Patrice Koehl |
Introduction to Computers: Fall 2013Lab3: Advanced Excel techniques (II)The assignment for this lab can be simply stated: Apply your knowledge on Excel to create an Excel worksheet that allows you to analyze your personal expenses (including costs related to being in college) over a quarter (say winter quarter). Turn in your answer as a simple worksheet. You may find it useful to go to the Microsoft Training web pages to do more tutorials on Excel. If you decide to do so, remember that you will have to use Internet Explorer to run the tutorials. If you have troubles starting the program, you may have to click the message bar of Internet Explorer to permit the download of the ActiveX program.
Again, you will not need to save your work as you progress through the tutorials.
Compiling and analyzing your quaterly expensesHow much do we spend each month? each quarter? Can we track our expenses in a format that makes it easy to analyse them so that we have a better understanding of where we stand? Well, Excel is an excellent tool for organizing any data we have on this. In this lab, you will generate a worksheet that will allow you to analyse your (expected) expenses over the fall quarter 2013, covering the months of September, October, November, and December. Obviously, I do not want you to submit your actual expenses as a lab report: these are personal data that I should never have access to! I want you however to create the framework that allows you to analyse these data, to fill this framework with artificial data, and perform the analysis. In the figure below, I show you an example that I generated, using "artificial data" for fall 2011: 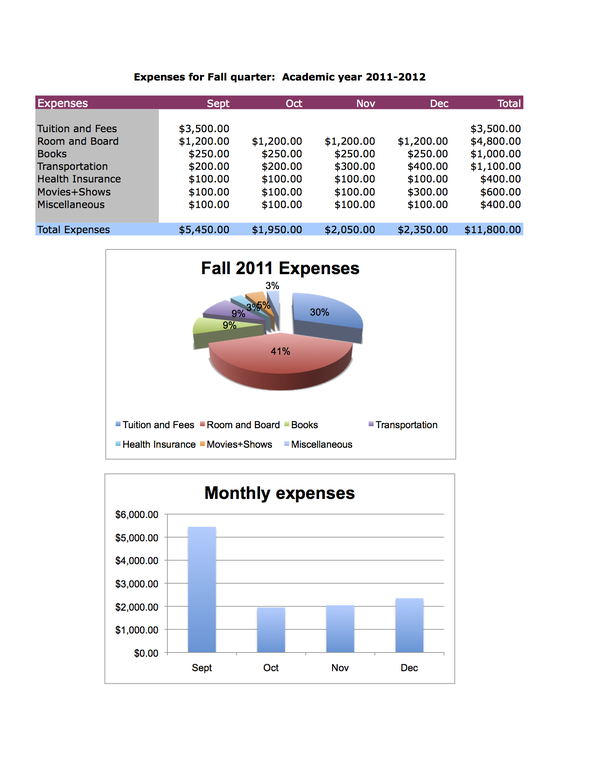
Your assignmentPrepare an Excel worksheet that includes:
The table and the two plots may be positioned on a single page, or on different pages of the worksheet. Note that once you have satisfied the requirements listed above, you are free to modify the presentation of the worksheet: for example, you do not have to use the same colors I have used. File submissionPlease submit your report as a single document (you can name this document as you want, but do keep the .xlsx extension).It is very important to turn in your assignment. If you do not turn in, you will not get your credit. USE SMARTSITE to save your assignment. If you are not sure how to do it, ask a TA for help. Do not forget to logout from the lab computers!GradingPlease look at the breakdown below that will be used for grading your assignment:
There is a total of 30 points for this assignment. |
| Page last modified 17 December 2015 | http://www.cs.ucdavis.edu/~koehl/ |