is a magic matrix with sum = 34.
Write a small program that checks if a matrix of any size is magic.
Exercise 2: Challenge: sum of Fibonacci numbers
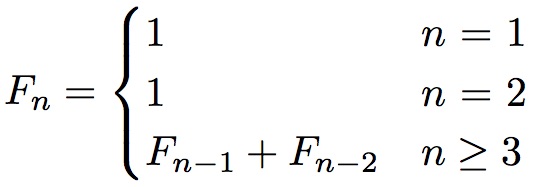
Remember the Fibonacci sequence from Lab 1. As a reminder, it is defined as follows:
Write a MATLAB script that computes the sum of the Fibonacci numbers Fn, for n between 1 and a given number N, with Fn being a multiple of 2 or 5.
For example, when N = 5, only F3 and F5 are multiples of 2 or 5, and the sum is: S = F3 + F5 = 7.
Check your program for N = 10, 15, 20, and 30 (in which cases S = 104, 858, 10207, and 1171004).
Exercise 3: Analyzing biological data
A simple experiment was designed to analyze the effects of noise on gene expression within a cell: a cell has been engineered to contain two genes (which we will label as C and Y) that are supposed to be expressed identically. In the presence of noise however, the expression levels will differ. There are two possible source of noise:
- Extrinsic noise: noise related to all external factors that may affect gene expression
- Intrinsic noise: noise related to the gene expression machinery itself
Two different experiments were conducted, each with a different type of cell. In experiment 1, data (i.e. expression levels for C and Y) were collected for 30 cells, while in experiment 2, data were available for 37 cells. The raw data are in the two files:
Data_exp1.dat Data for experiment 1
Data_exp2.dat Data for experiment 2
(In each file, the first and second columns correspond to the expression levels of C and Y, respectively).
Write a Matlab script for analyzing these data:
- Generate a plot (scattered plot) of Y as a function of C for each experiment
- Compute the levels of intrinsic, \(\eta_{int}^2\), extrinsic, \(\eta_{ext}^2\), and total \(\eta_{tot}^2\) noise in each experiment
You will use the formula:
$$\eta_{int}^2 = \frac{\left \langle (c-y)^2 \right \rangle}{2\langle c \rangle \langle y \rangle} \quad \quad \eta_{ext}^2 = \frac{\langle cy \rangle - \langle c \rangle \langle y \rangle}{\langle c \rangle \langle y \rangle} \quad \quad \eta_{tot}^2 = \frac{\langle c^2 + y^2 \rangle - 2\langle c \rangle \langle y \rangle}{2 \langle c \rangle \langle y \rangle}$$