

Patrice Koehl
Department of Computer Science
Genome Center
Room 4319, Genome Center, GBSF
451 East Health Sciences Drive
University of California
Davis, CA 95616
Phone: (530) 754 5121
koehl@cs.ucdavis.edu
|
|
| Patrice Koehl |
Modeling and Data Analysis in Life Sciences: 2017Lab3: Data Analysis and Data ModelingHandoutsData Analysis and Data Modeling:
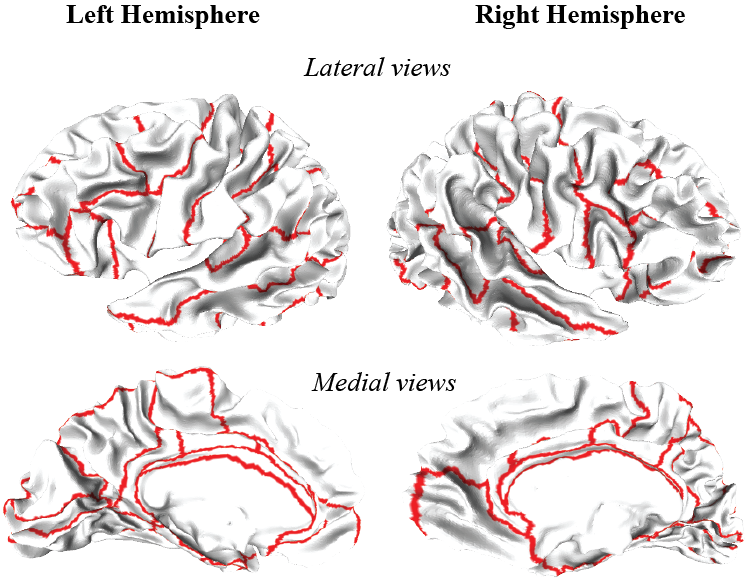
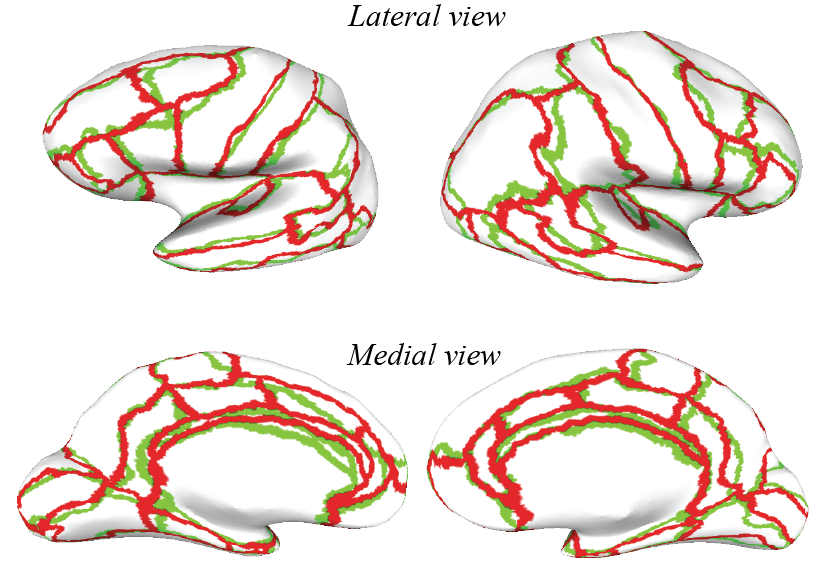
Word document (click to download) or PDF document (click to download) Exercise 1: Checking if a method is statistically better than anotherFinding efficient algorithms to describe, measure and compare shapes is a central problem in image processing. This problem arises in numerous disciplines that generate extensive quantitative and visual information. Among these, biology occupies a central place. For example, registration of brain anatomy is essential to many studies in neurobiology. Here we consider the problem of aligning 38 brains (defined by their cortical surface) onto a template brain. Each brain consists of two independent hemispheres, Left, and Right. We have two methods for aligning the hemisphere of a brain onto the corresponding hemisphere of the template, Method1 and Method2. For each method, we align the hemisphere onto the template and check the quality of the alignment by comparing the positions of 35 regions between the aligned brain and the template. Figure 1 illustrates the positions of these regions, while Figure 2 shows one example of an alignment.
We will only consider the left hemisphere in this exercise. The files Left1.dat and Left2.dat below give the results of the alignments for Method1 and Method2, respectively Left1.dat Data for method 1Left2.dat Data for method 2 Each file includes a large table with 35 rows, for the 35 regions of interest, and 38 columns, for the 38 brains considered. The value for a row I and a column J gives the distance between the region I in brain J and the same region in the template brain. Note that the lower the distance, the better. For each region, compare the two distributions of distance values obtained over all 38 brains for the two alignment methods, indicate if these distributions are significantly different (at 95% confidence level), and which of the two methods works best. How would you present these results? Exercise 2: polynomial fittingIn the file census.dat (available on the web site), I have stored the census data for the population in the US between 1900 and 2010, by step. Our goal is to try to predict the population in the US in the year 2017. This population is 324.8 millions. We will use and discuss a naïve approach to this problem: find a polynomial fit to the data, where the polynomial may be of order 2 to 10, and compute the value of that polynomial for the year 2020. Do read carefully the help for the two main MATLAB functions you will need: polyfit and polyval. Once you understood those functions, write a MATLAB script that allows you to fill in this table:
Draw on the same plot the different fits obtained for polynomials of degree 2, 4, 6, 8, and 10. Comment your results. |
| Page last modified 15 June 2022 | http://www.cs.ucdavis.edu/~koehl/ |